forests
how to use this page
This page has two panels: this one contains the article, and the panel on the right is for interactive media. Scrolling in either panel will advance the story, and jump the other panel to the correct section.
Tropical rainforests are our planetary life support system, providing ecosystem services from new medicines, to habitat for more than half of the world's plant and animal species. Over 1.6 billion people rely on forests for their livelihood, and yet despite commitments from countries to end deforestation, our forests continue to fall.
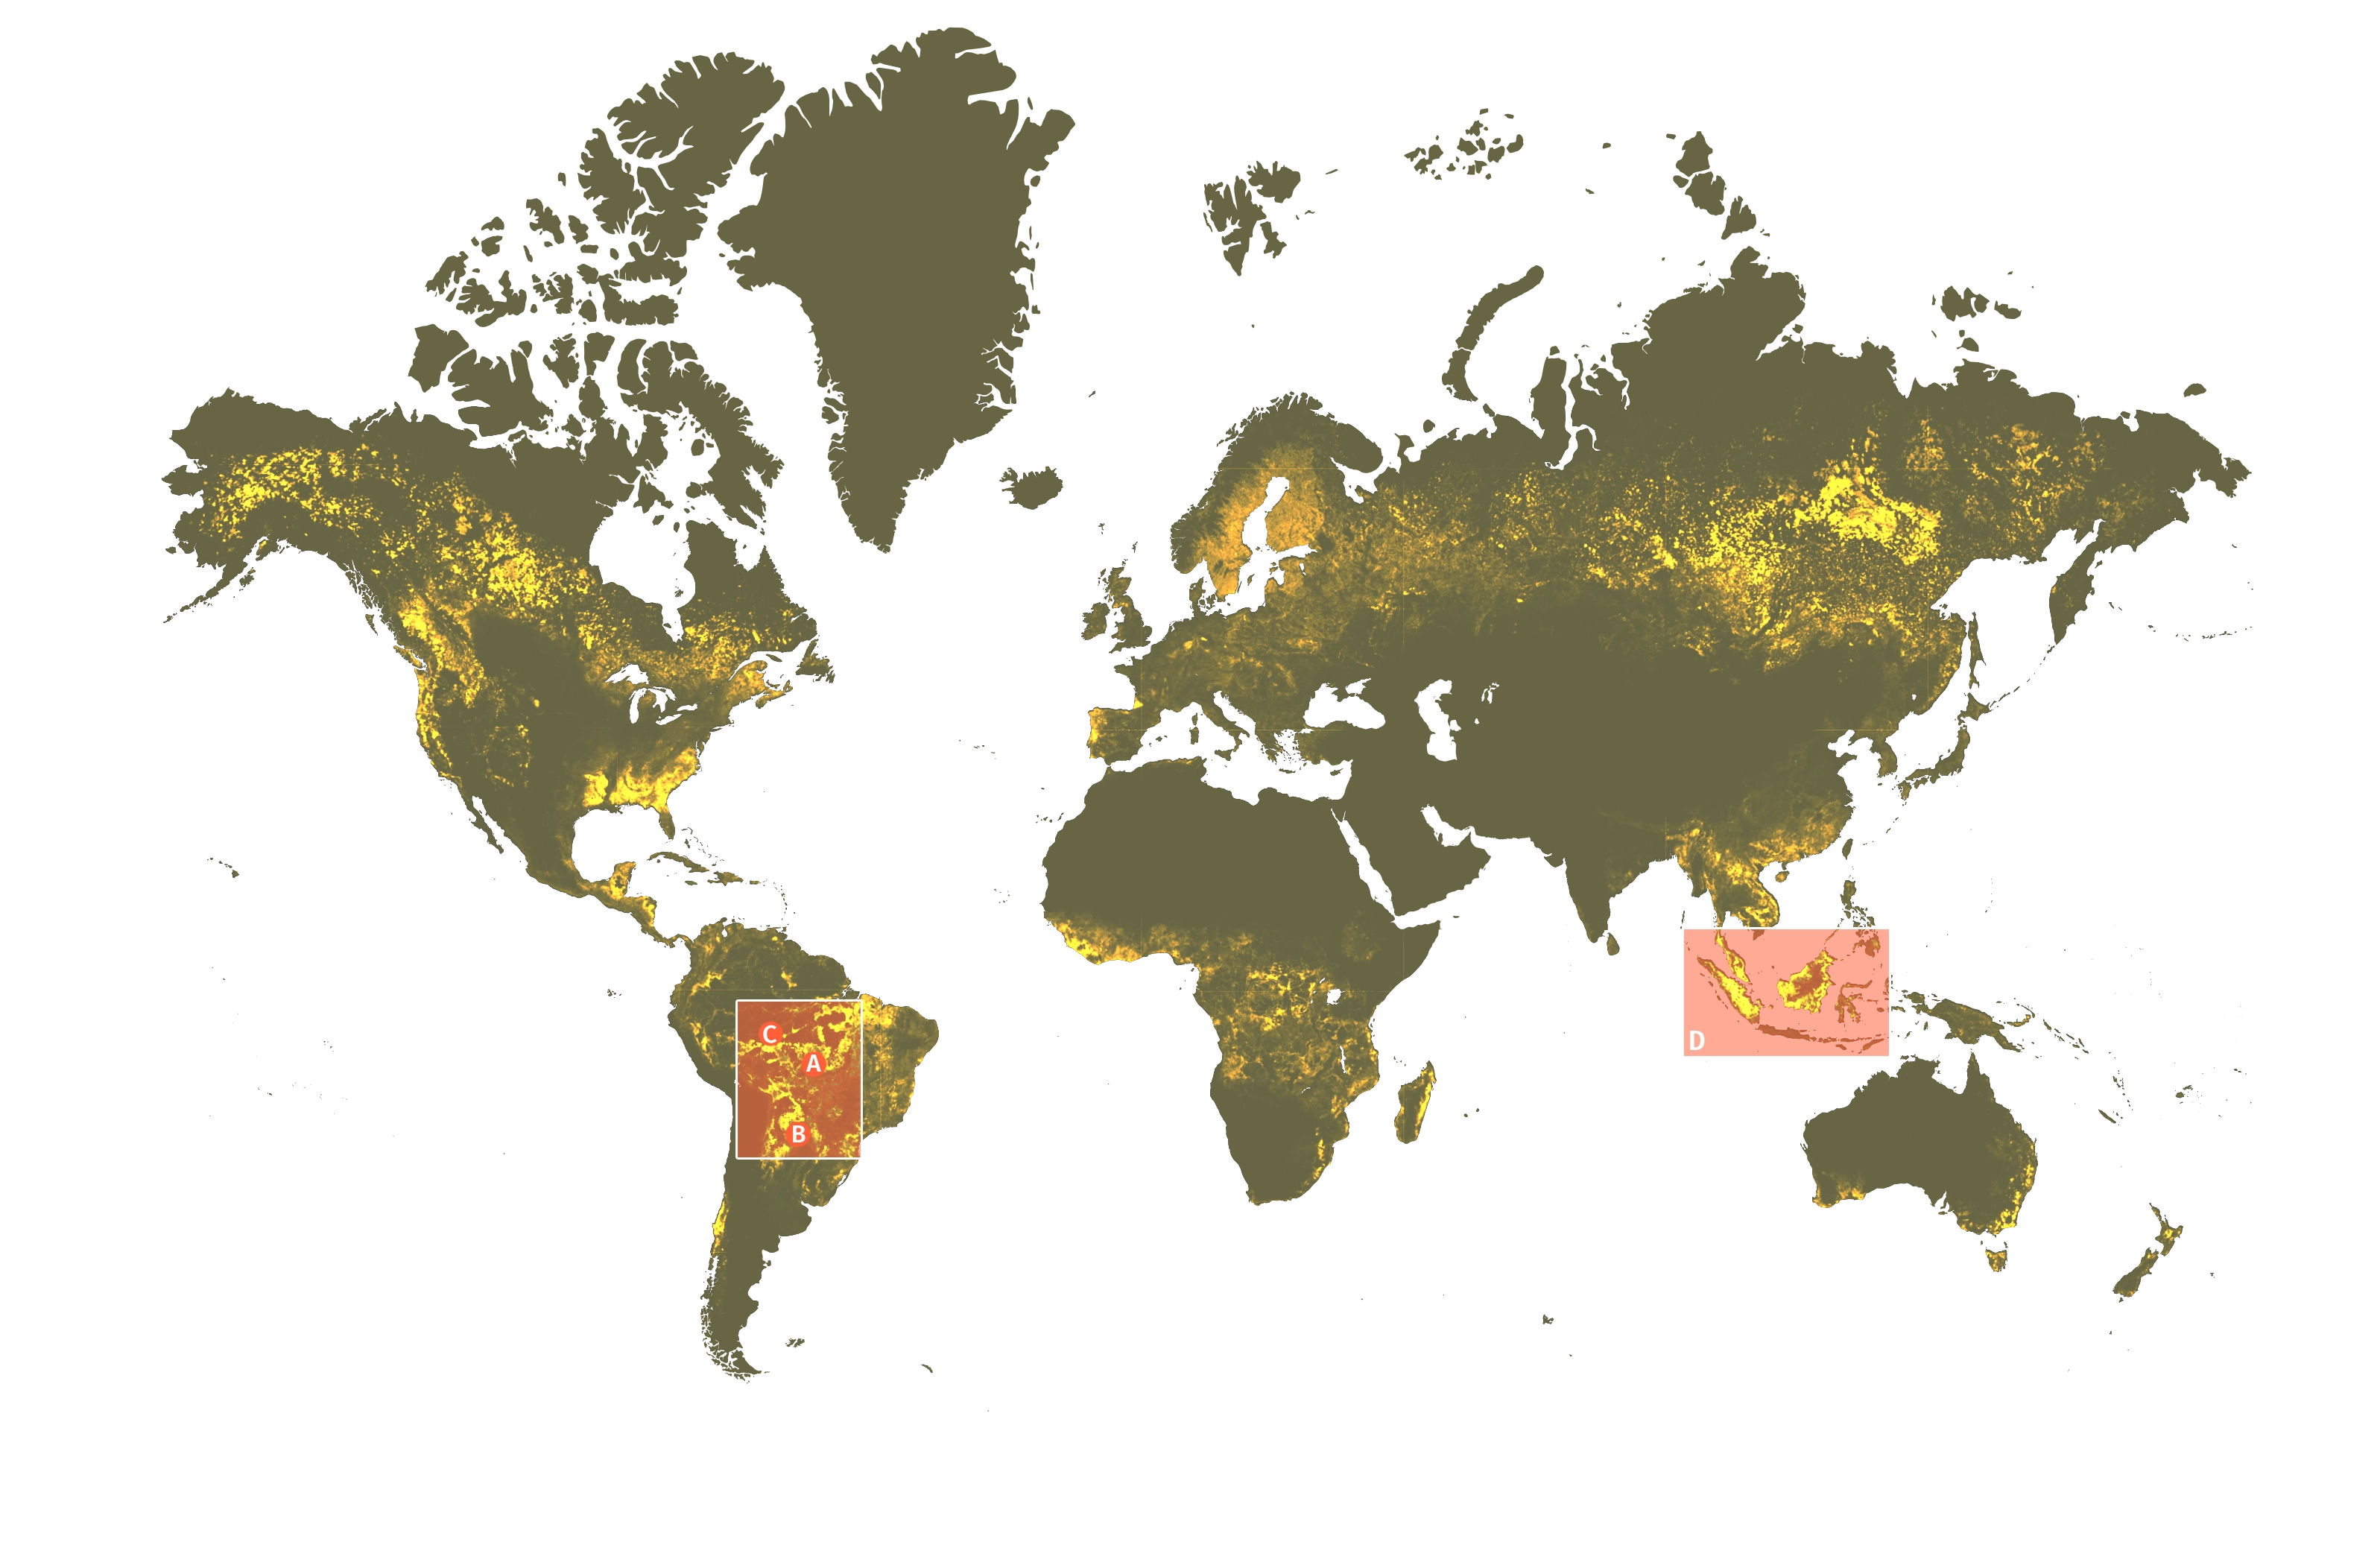
By processing and animating decades of satellite data, this report reveals the underlying political, economic and environmental factors driving forest loss in South America and South East Asia.
South-East Asia
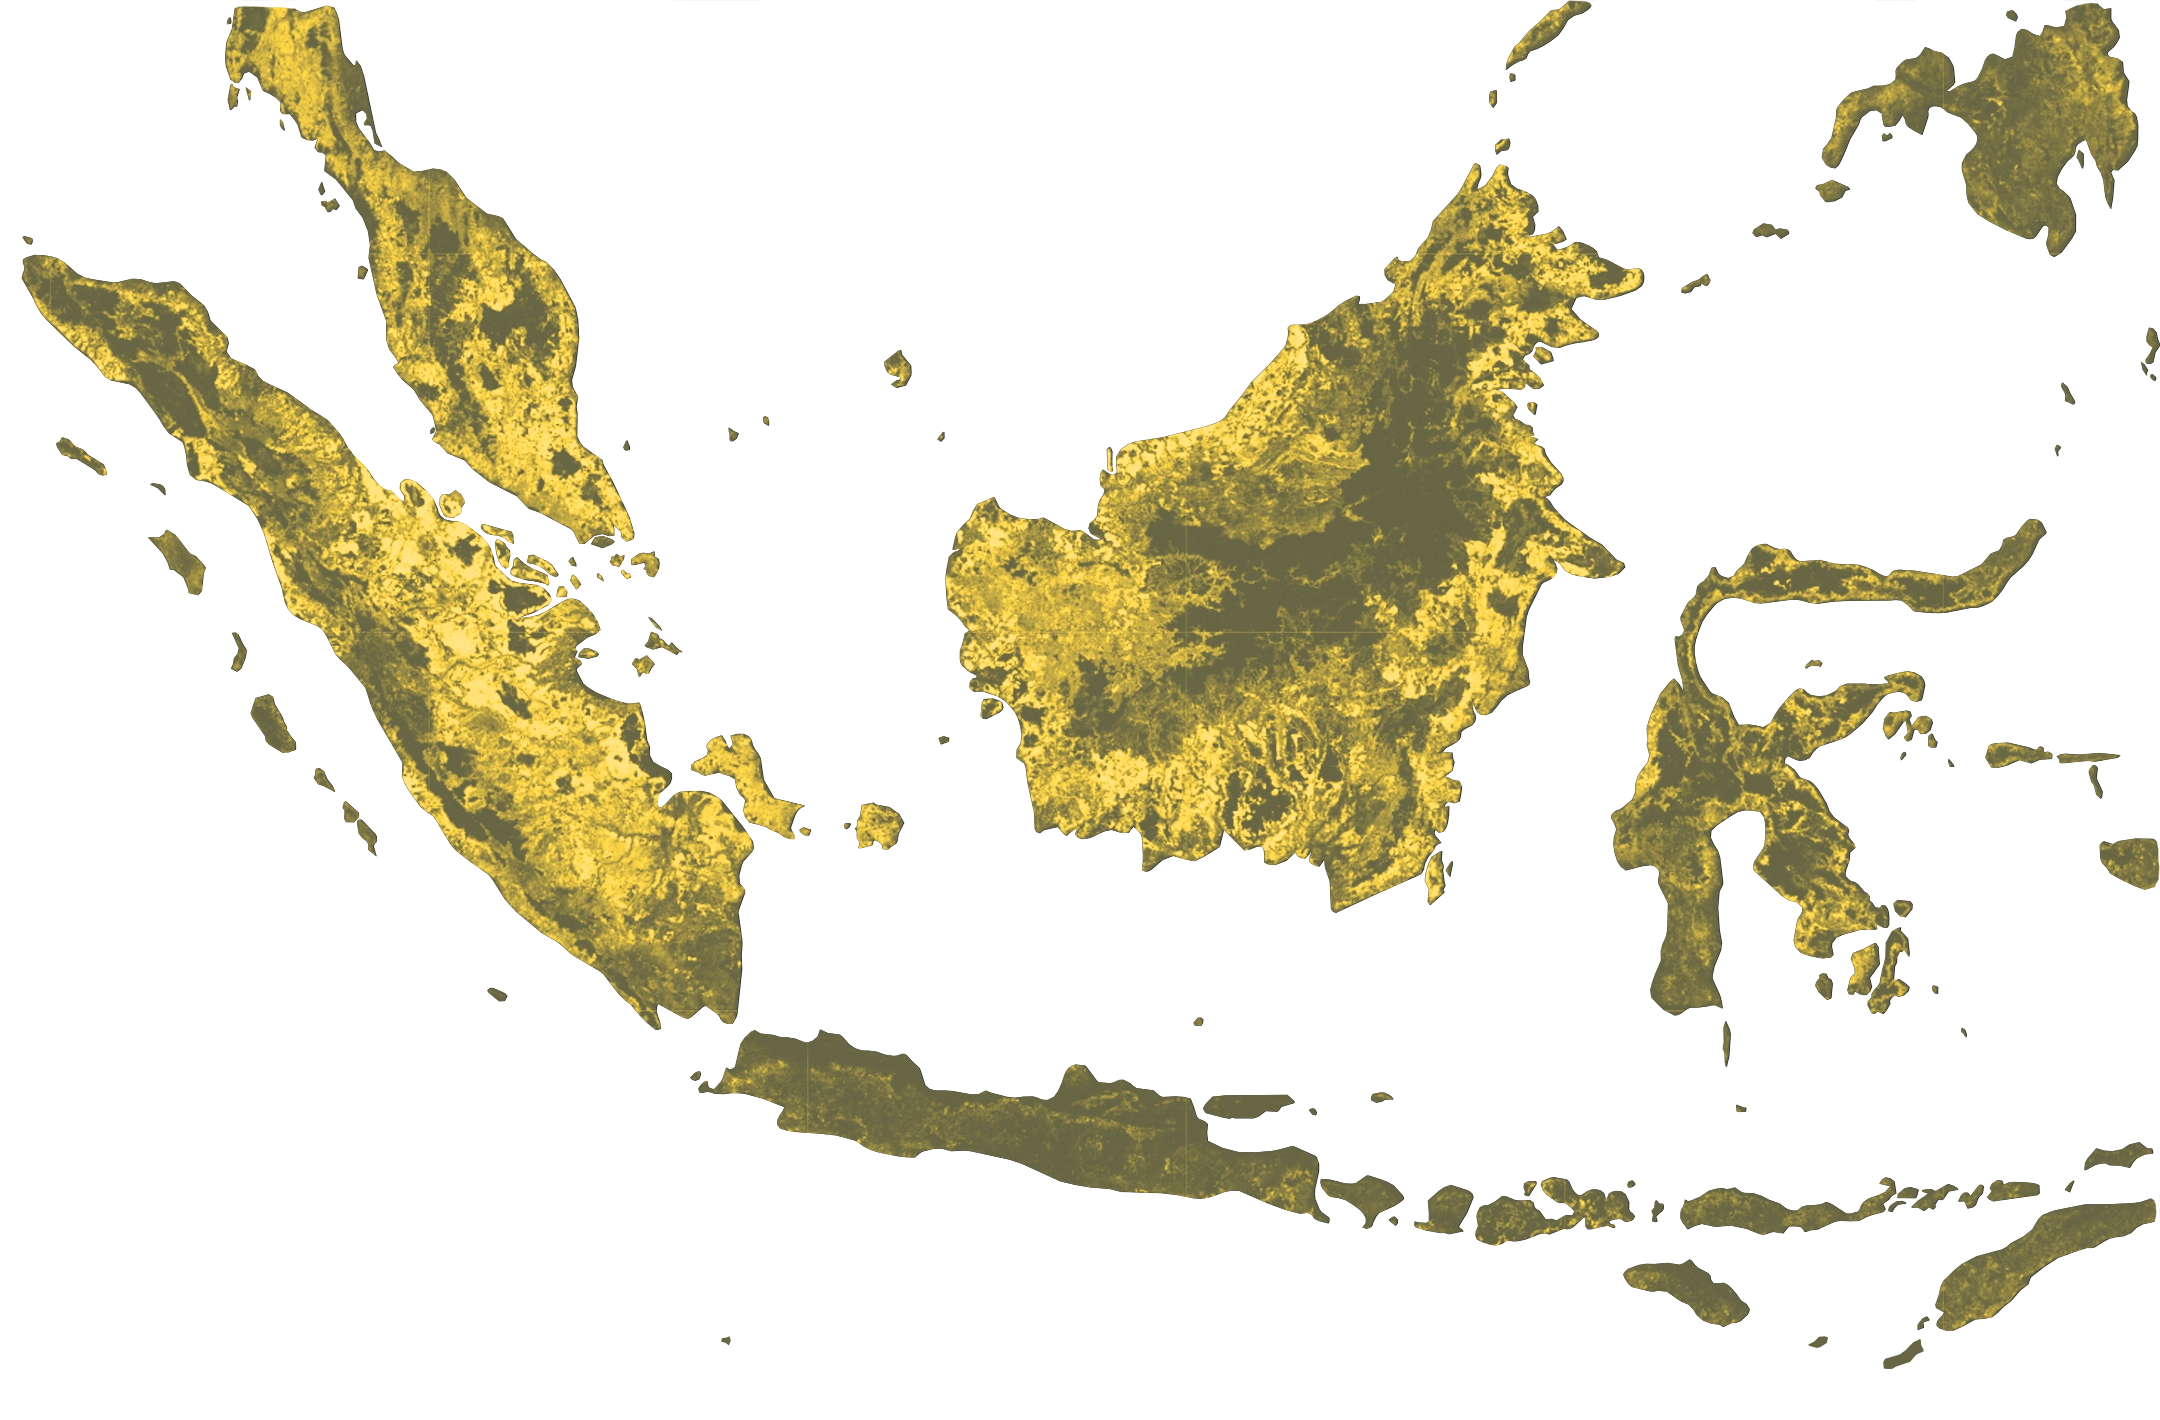
South East Asia is home to both 15% of the world's tropical rainforests, and the highest deforestation levels on the planet. Each year, the region loses 1.2% of its forest cover to agricultural expansion, logging, and mining.
Despite covering just 7% of the planet's land surface, forests in the region host almost two thirds of the world's biodiversity, and 68% of global carbon stocks.
South America
South America is a particularly important region for our forests. The Amazon Rainforest alone contains 400 billion trees, 150 billion tonnes of carbon, and 10% of all the known species on Earth. So far, it's estimated to have lost about 17% of its forest cover: an area the size of France.
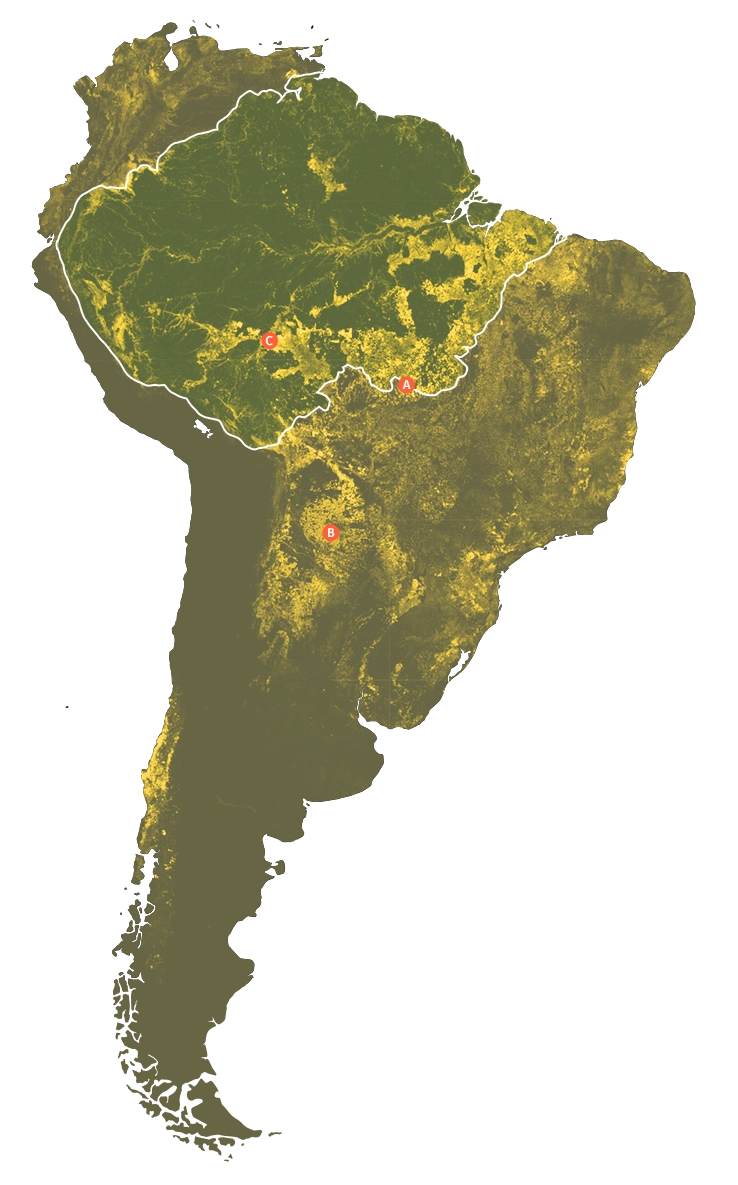
Let's begin by zooming into three sites in South America: where different economic, political and environmental factors converge to create different patterns of forest loss.
Site Studies
Mato Grosso, Brazil
Mato Grosso is a region with three distinct biomes: rainforest, savannah, and wetland. From 2002 to 2022, 21% of humid primary forest was lost in the region, primarily due to cattle ranching and soybean cultivation.
Deforestation dynamics here are primarily shaped by the Amazon rainforest biome, where pasture and cropland spillover are primary drivers.
The 20x25km site represented here shows how deforestation can organically expand from the borders of previous clear-cuttings: advancing slowly at first, then rapidly between 2009 and 2011 as Brazil recovered from the global financial crisis.
The deforestation avoids riverbanks, which would carry practical concerns around suitability for cropland and pasture. This leaves meandering strips of forest cover that wind across the landscape alongside the river.
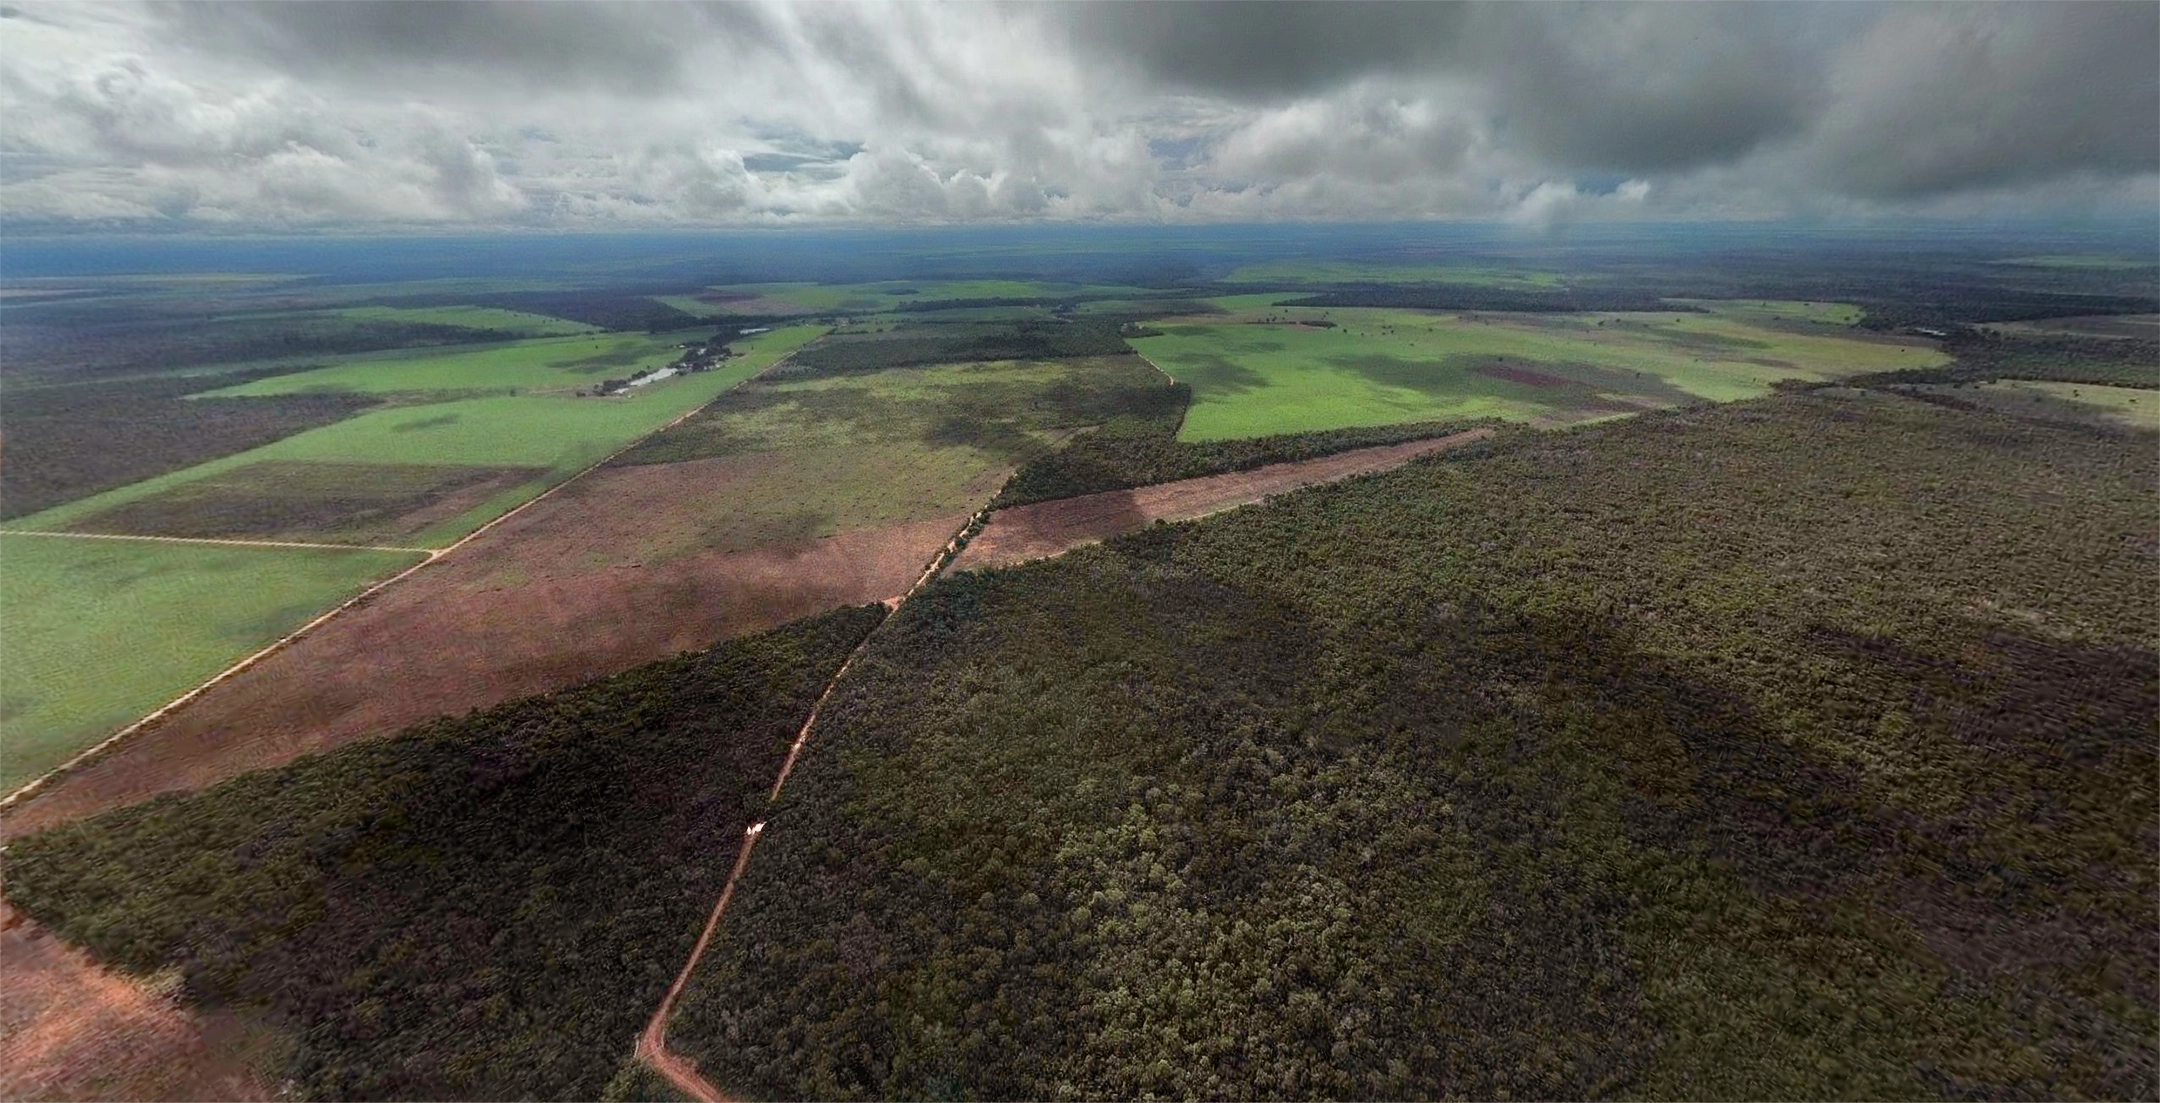
The pattern of deforestation appears to be organic, with fewer rigid borders. We see small areas cleared initially, shortly followed by much larger pockets of land.
This pattern is in part due to the popular slash and burn forest clearing technique, which by its nature is less precise than mechanized approaches found elsewhere.
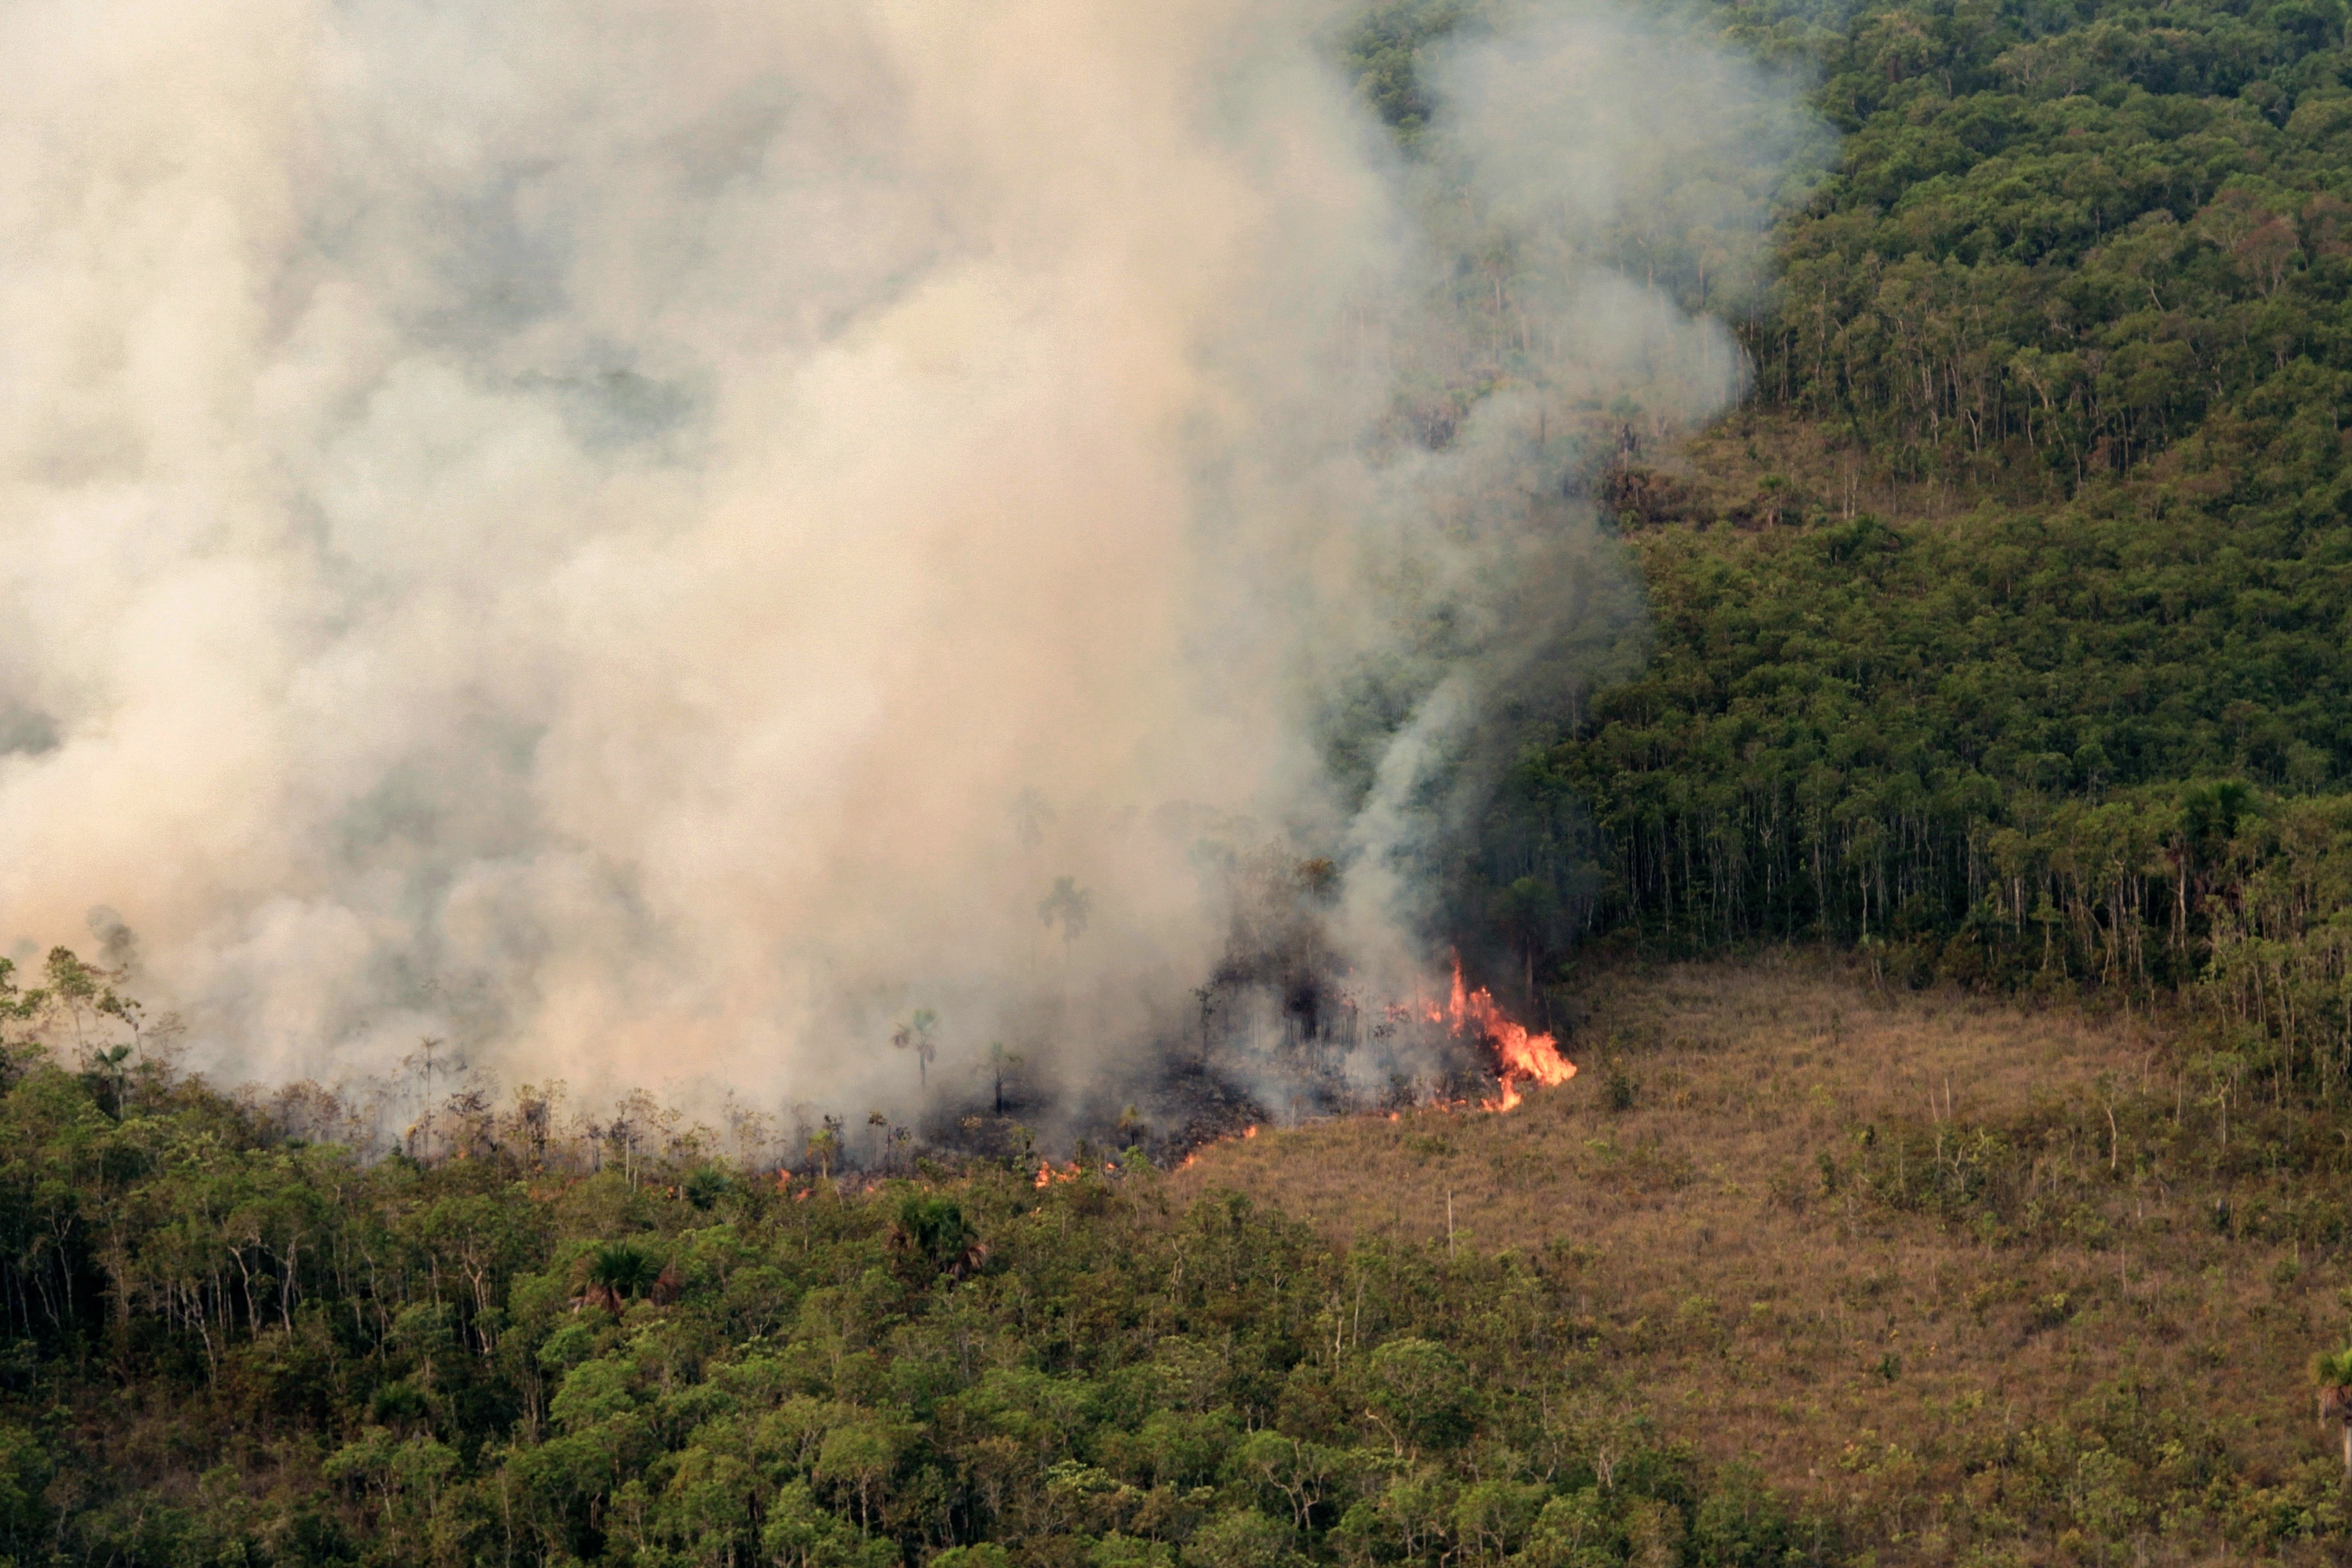
Gran Chaco, Paraguay
Forest loss patterns aren't always organic in appearance. In Pirizal, Paraguay, we see a pattern driven by a more mechanized approach to clear cutting.
The site is within The Gran Chaco: South America's second largest forest. Here, cattle ranching is the primary driver of forest clearing, which uses mechanized methods to clear large, rectangular patches of land.
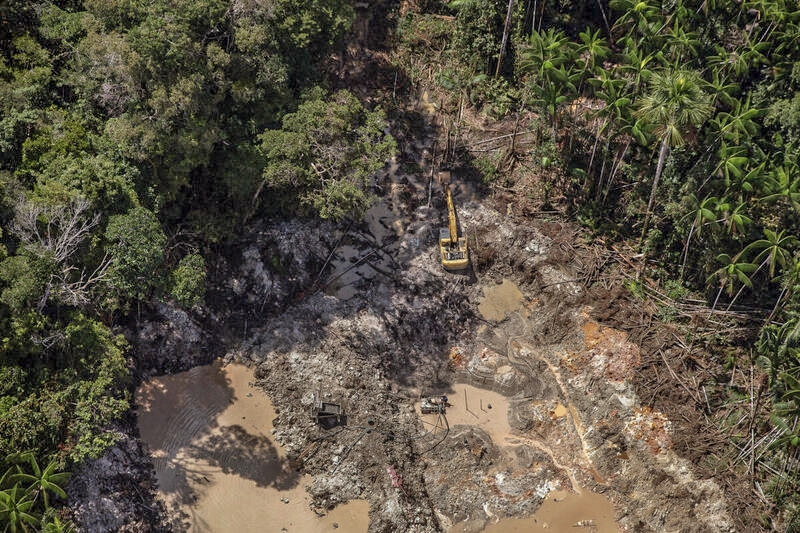
Here too, we see smaller patches of deforestation at the turn of the century, followed by much larger individual sites starting in 2009.
Rondonia , Brazil
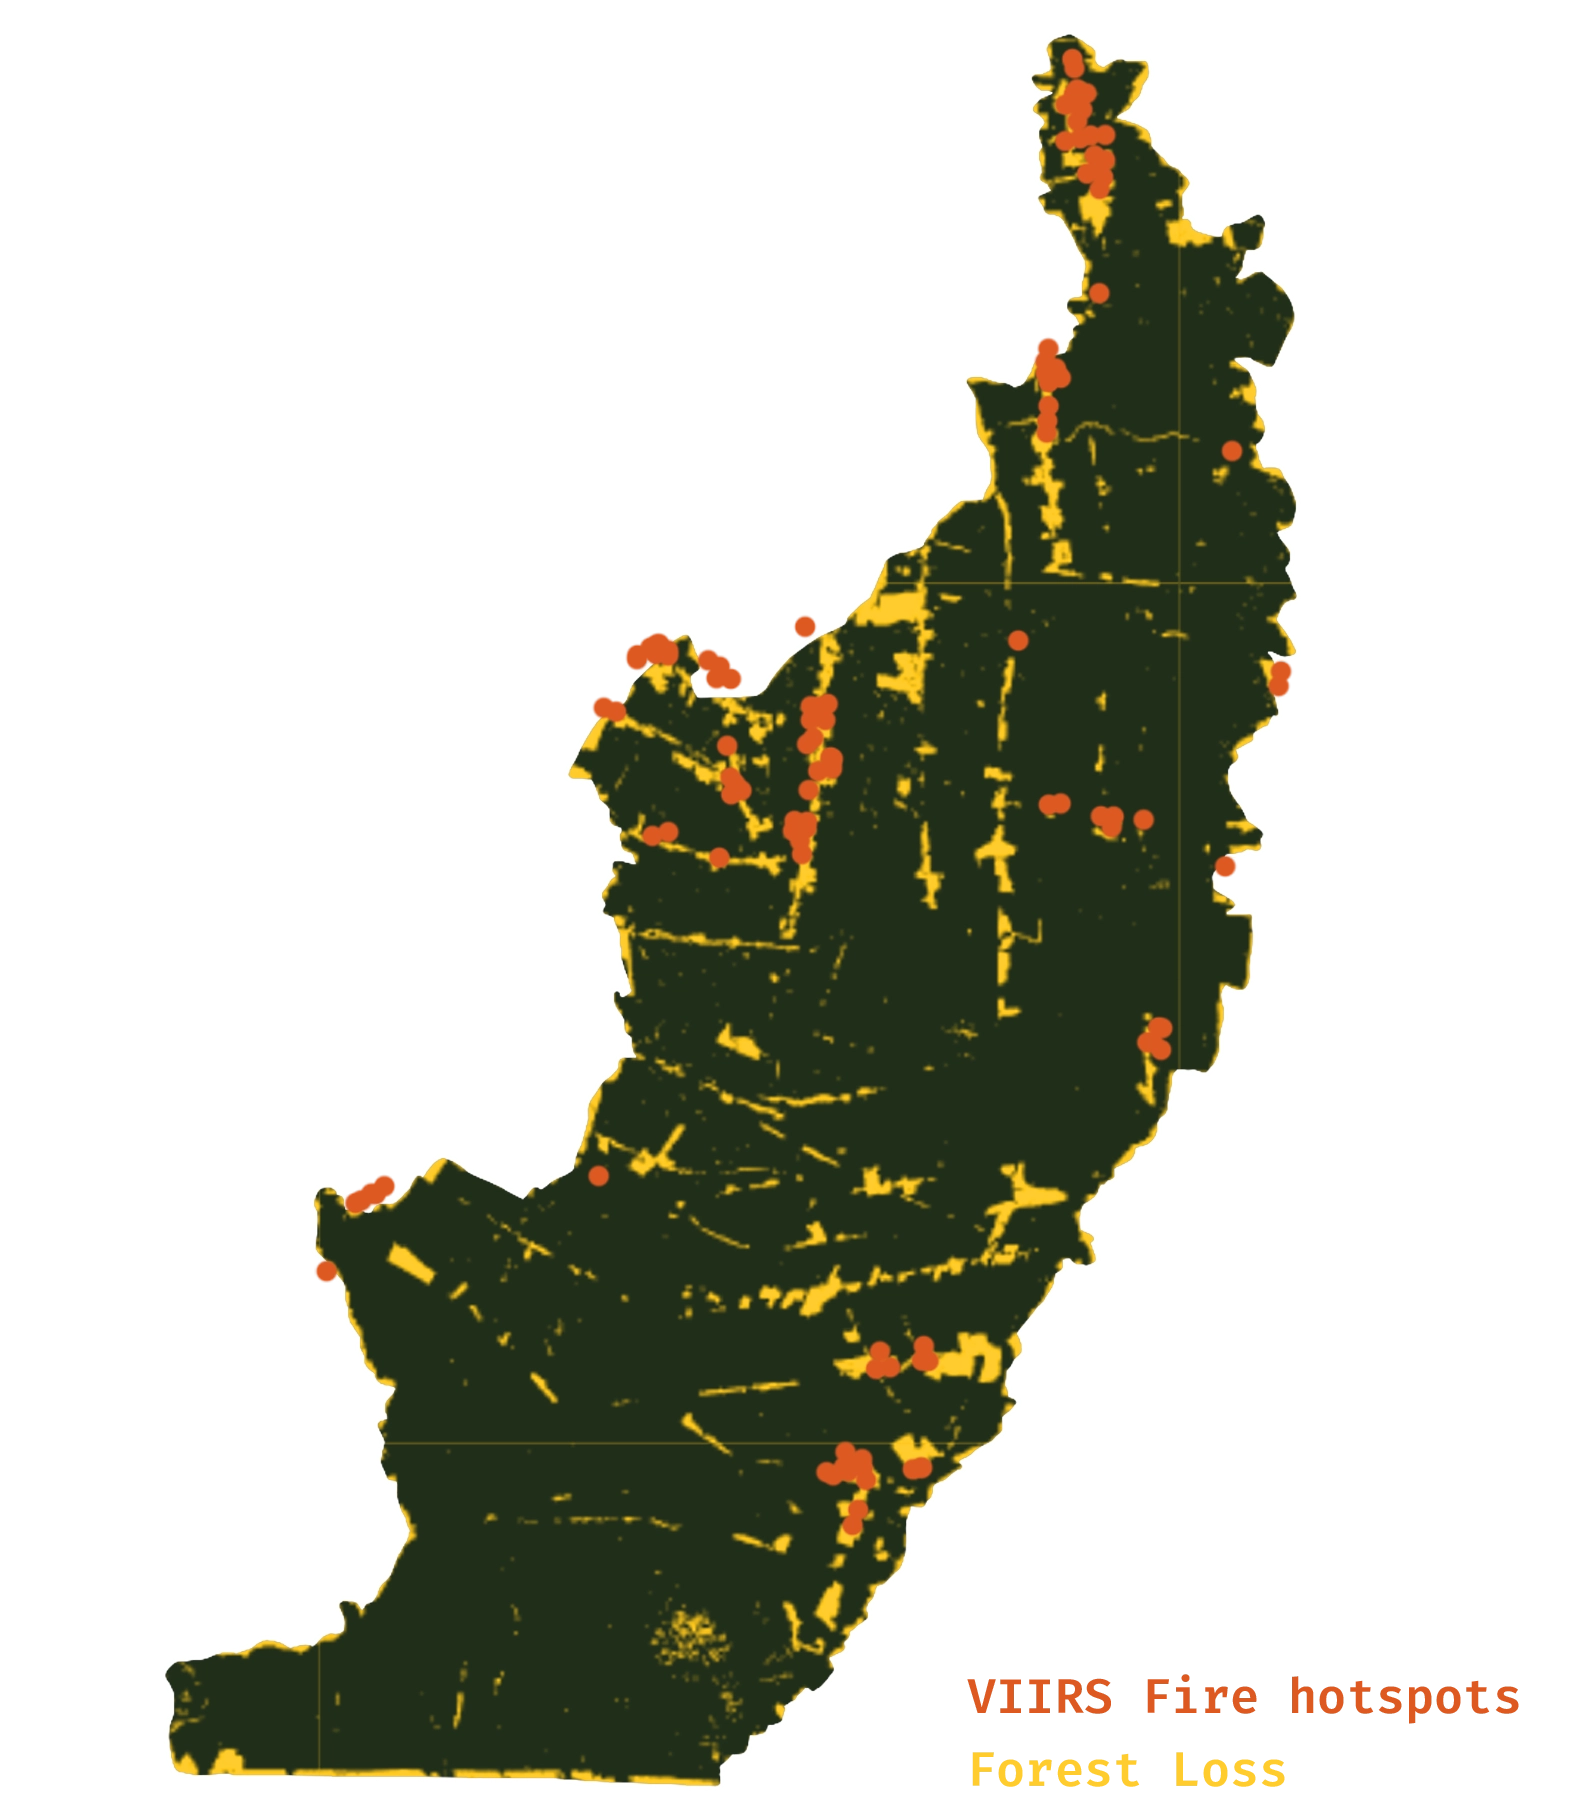
In Rondonia, Brazil, the deforestation pattern shows roads appearing before clearing begins, with subsequent patches of land cleared based on proximity to the road network. Behavior like this creates a fishbone pattern: driven by the logistical concerns of removing logs and crops from the cleared land.
Fishbone patterns can often be more harmful than other types of forest clearing, because they tend to create isolated islands of forest more quickly: cutting off vital routes for animals across their habitat range.
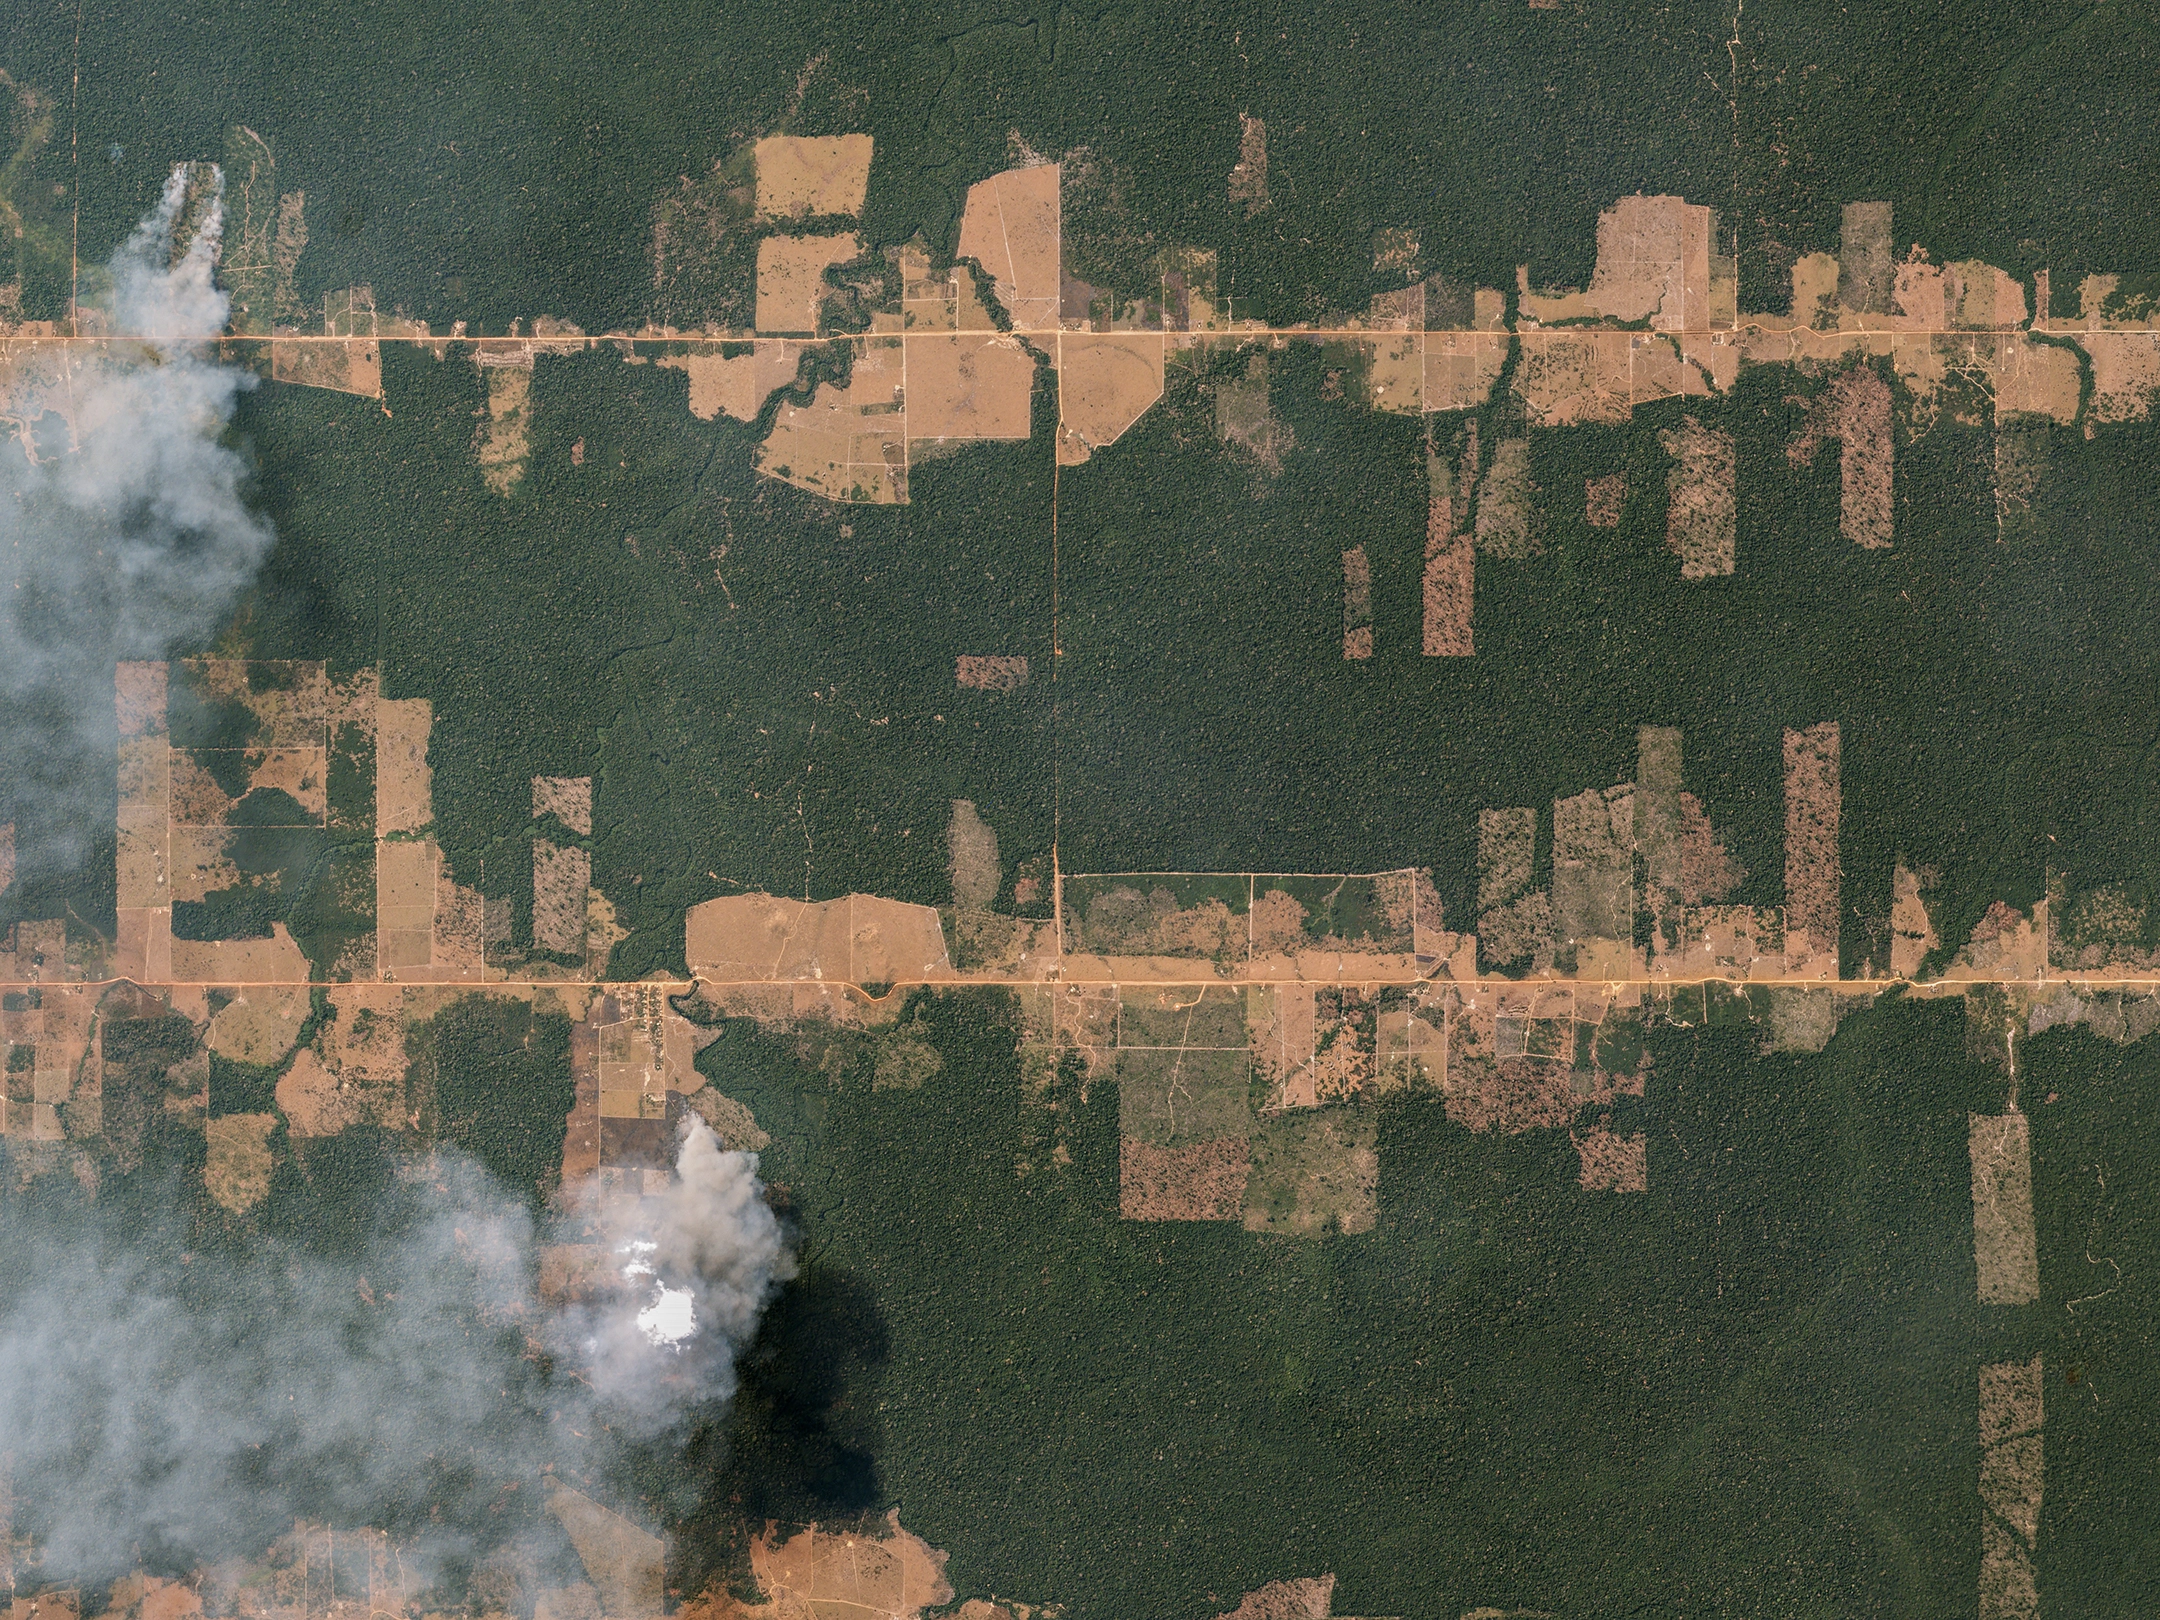
When we zoom out, we can see surrounding parcels of land following a similar pattern. Sitting in stark contrast: the neighboring protected land of the indigenous Karipuna people.
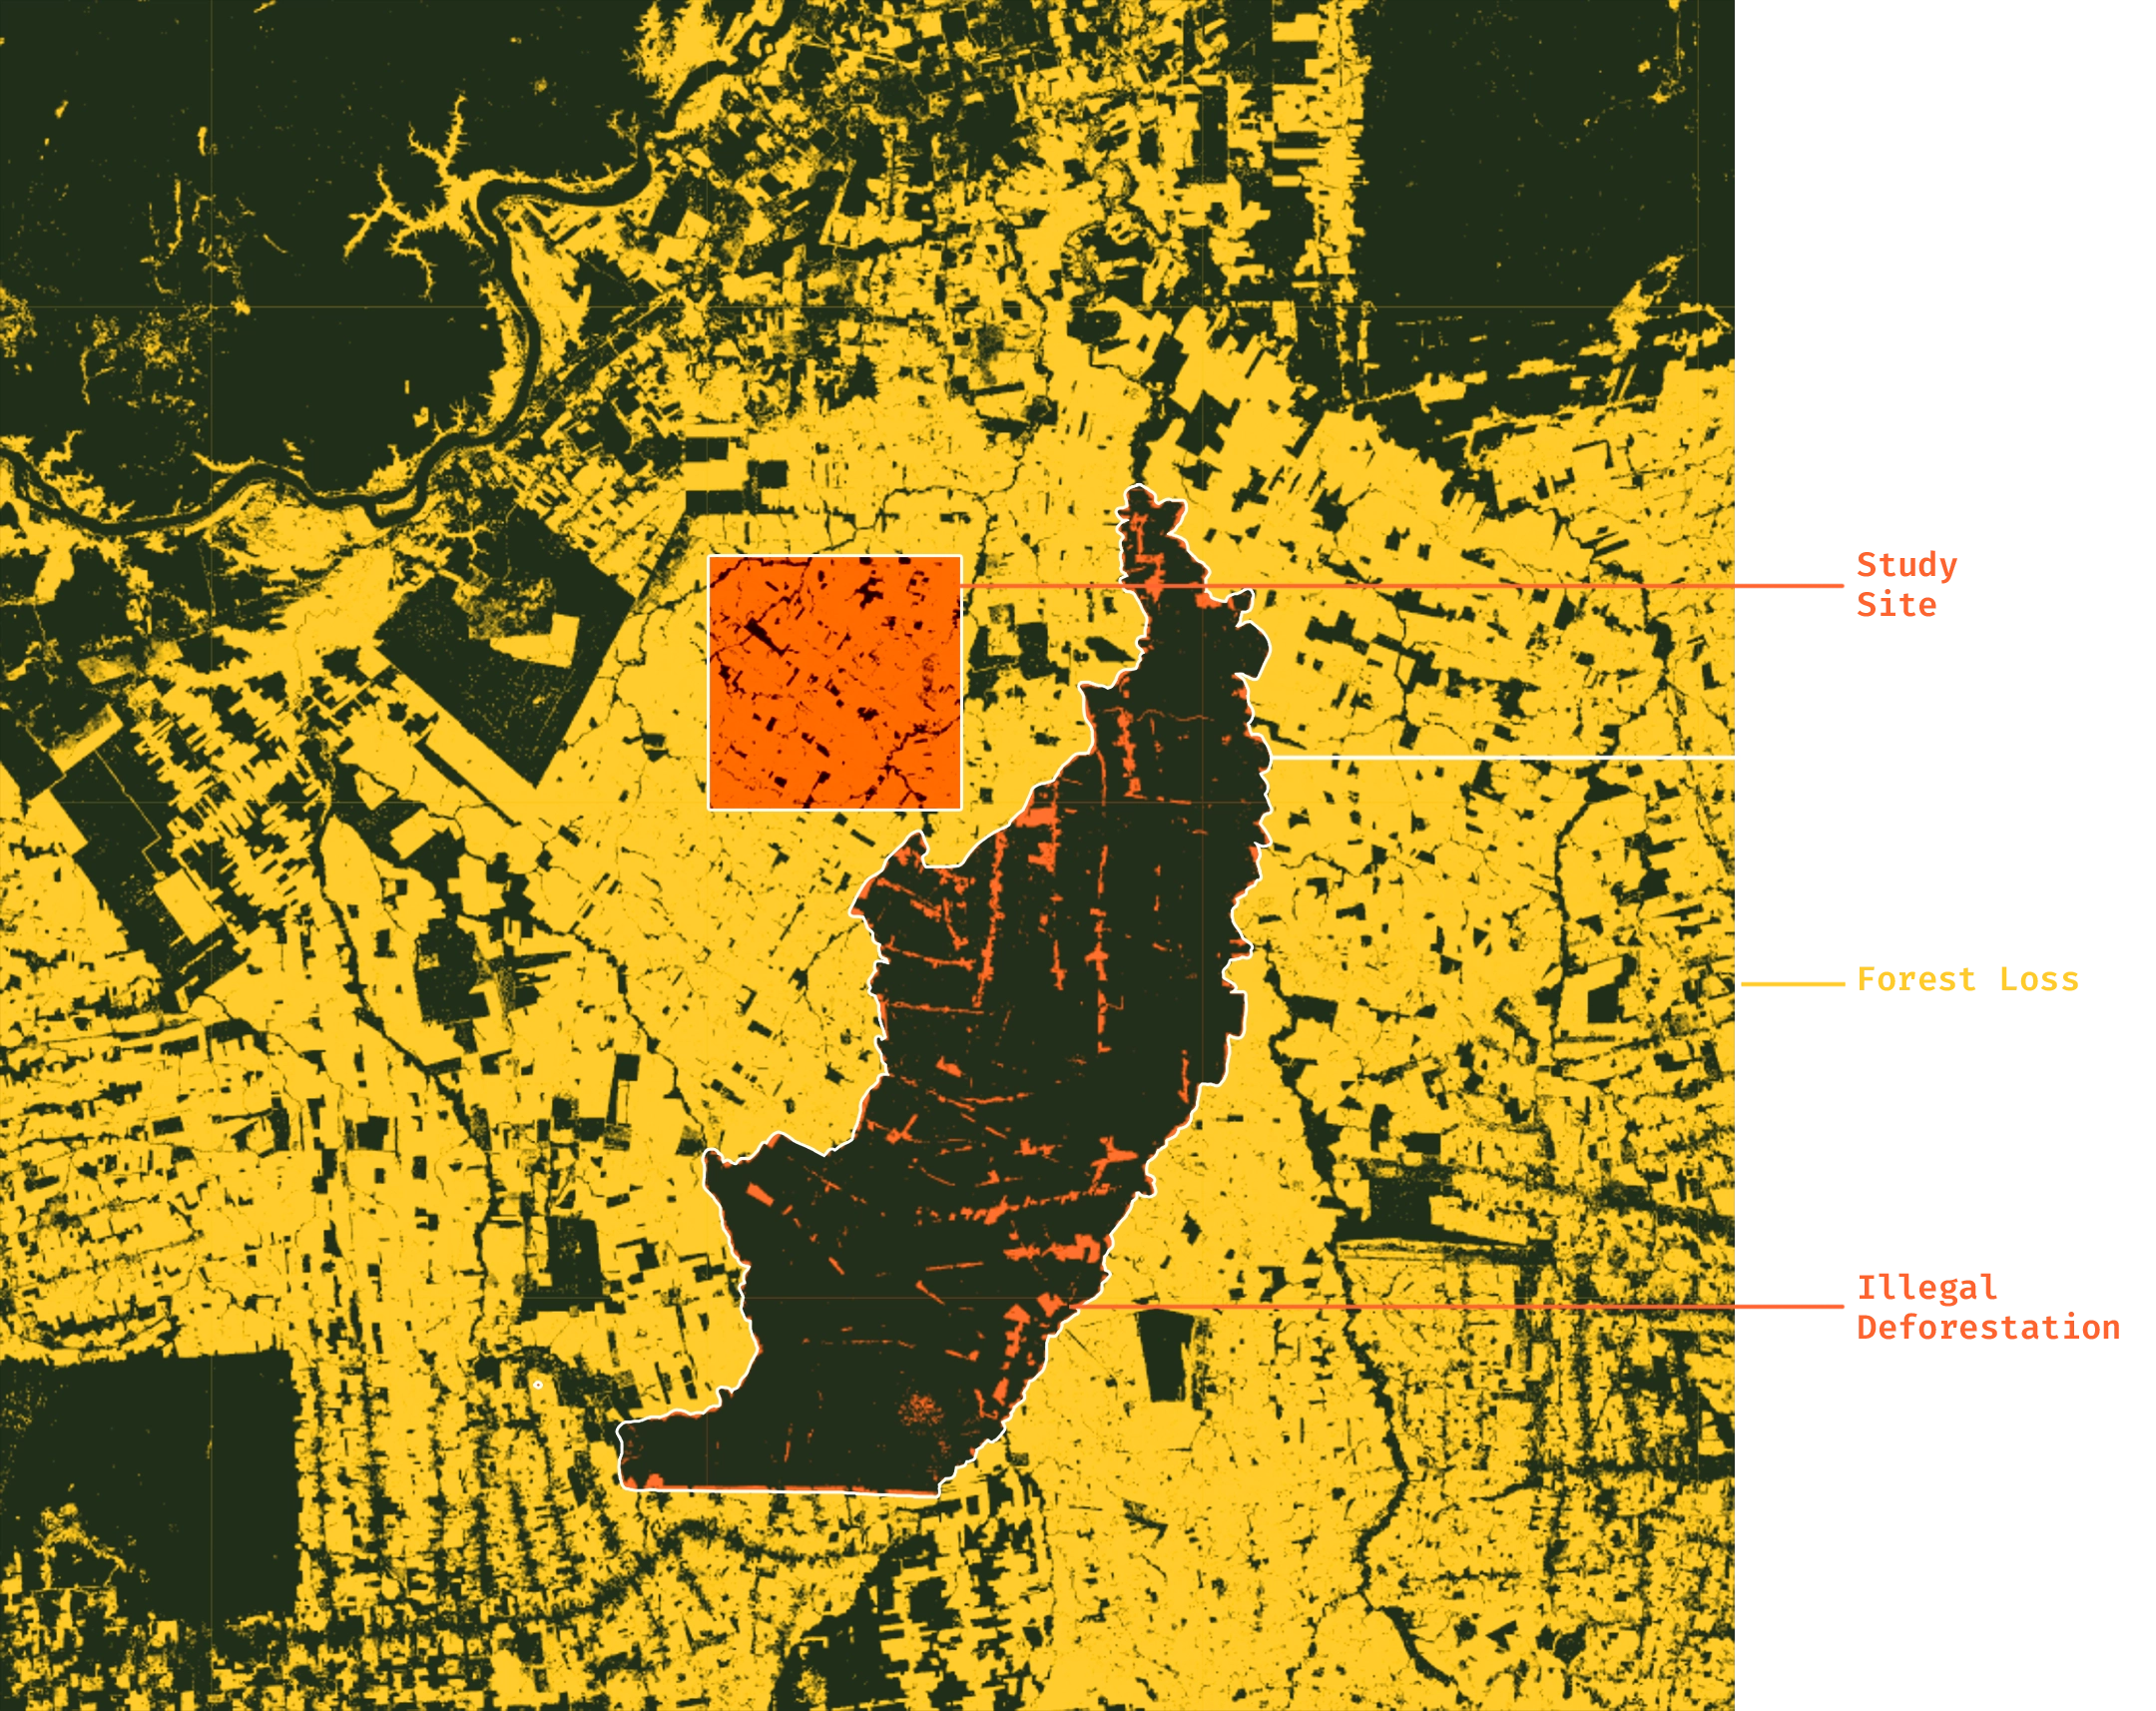
Even though the land is protected, The Karipuna people have had to defend it from illegal deforestation for decades. Looking more closely, we can see that the illegal deforestation in this region extends from the same road network as the surrounding area.
Forest Loss at Scale
South-East Asia
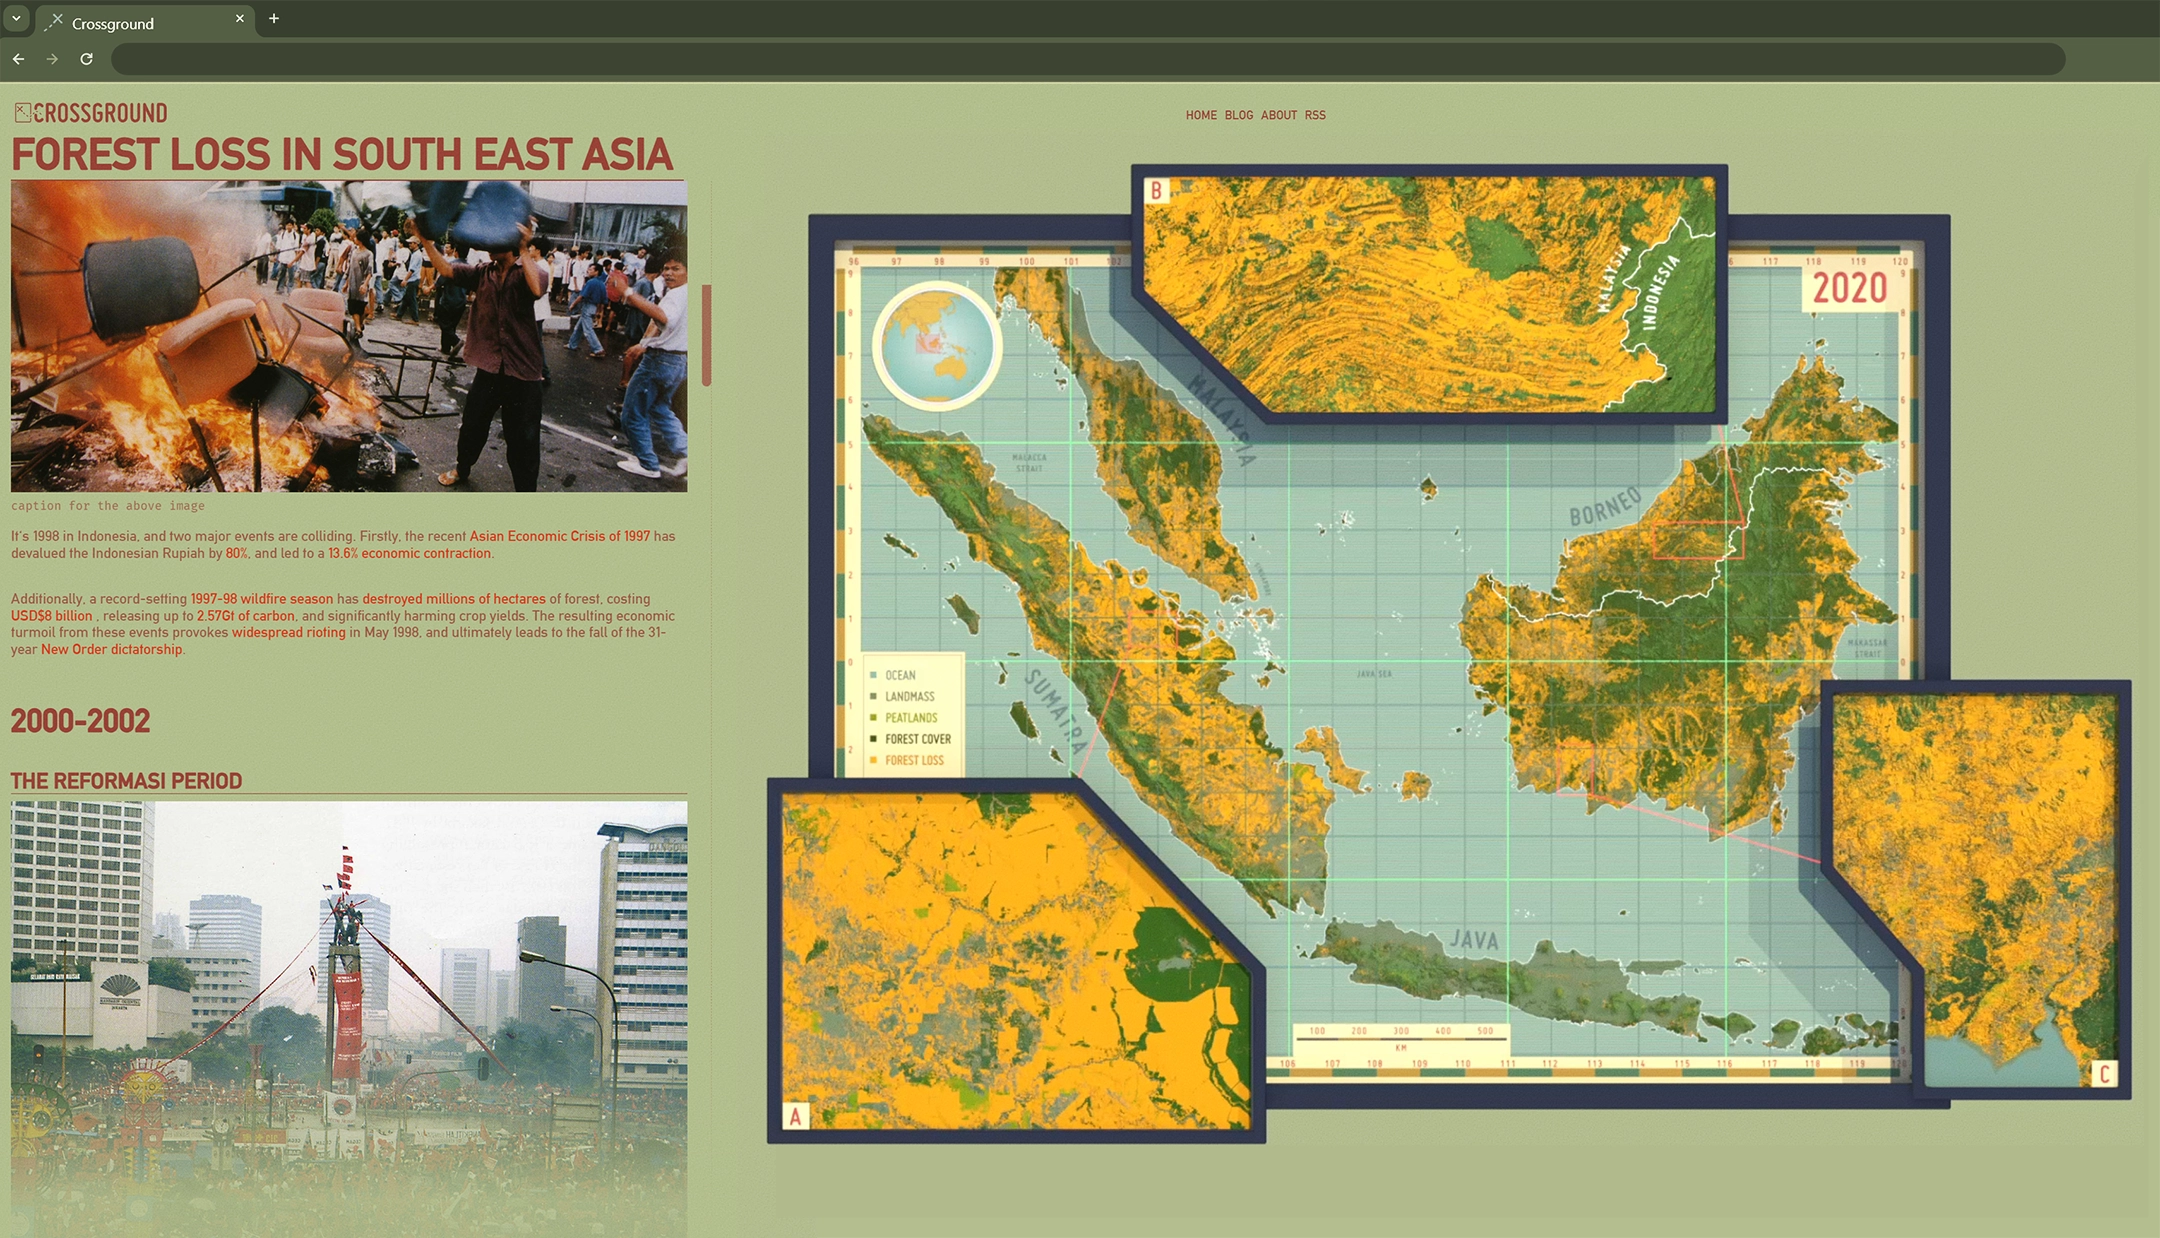
Exploring these patterns up close can show us valuable insights into the causes and potential response to ongoing regional forest loss. By zooming out even further, we can reveal another level of insight: this time at the scale of entire countries.
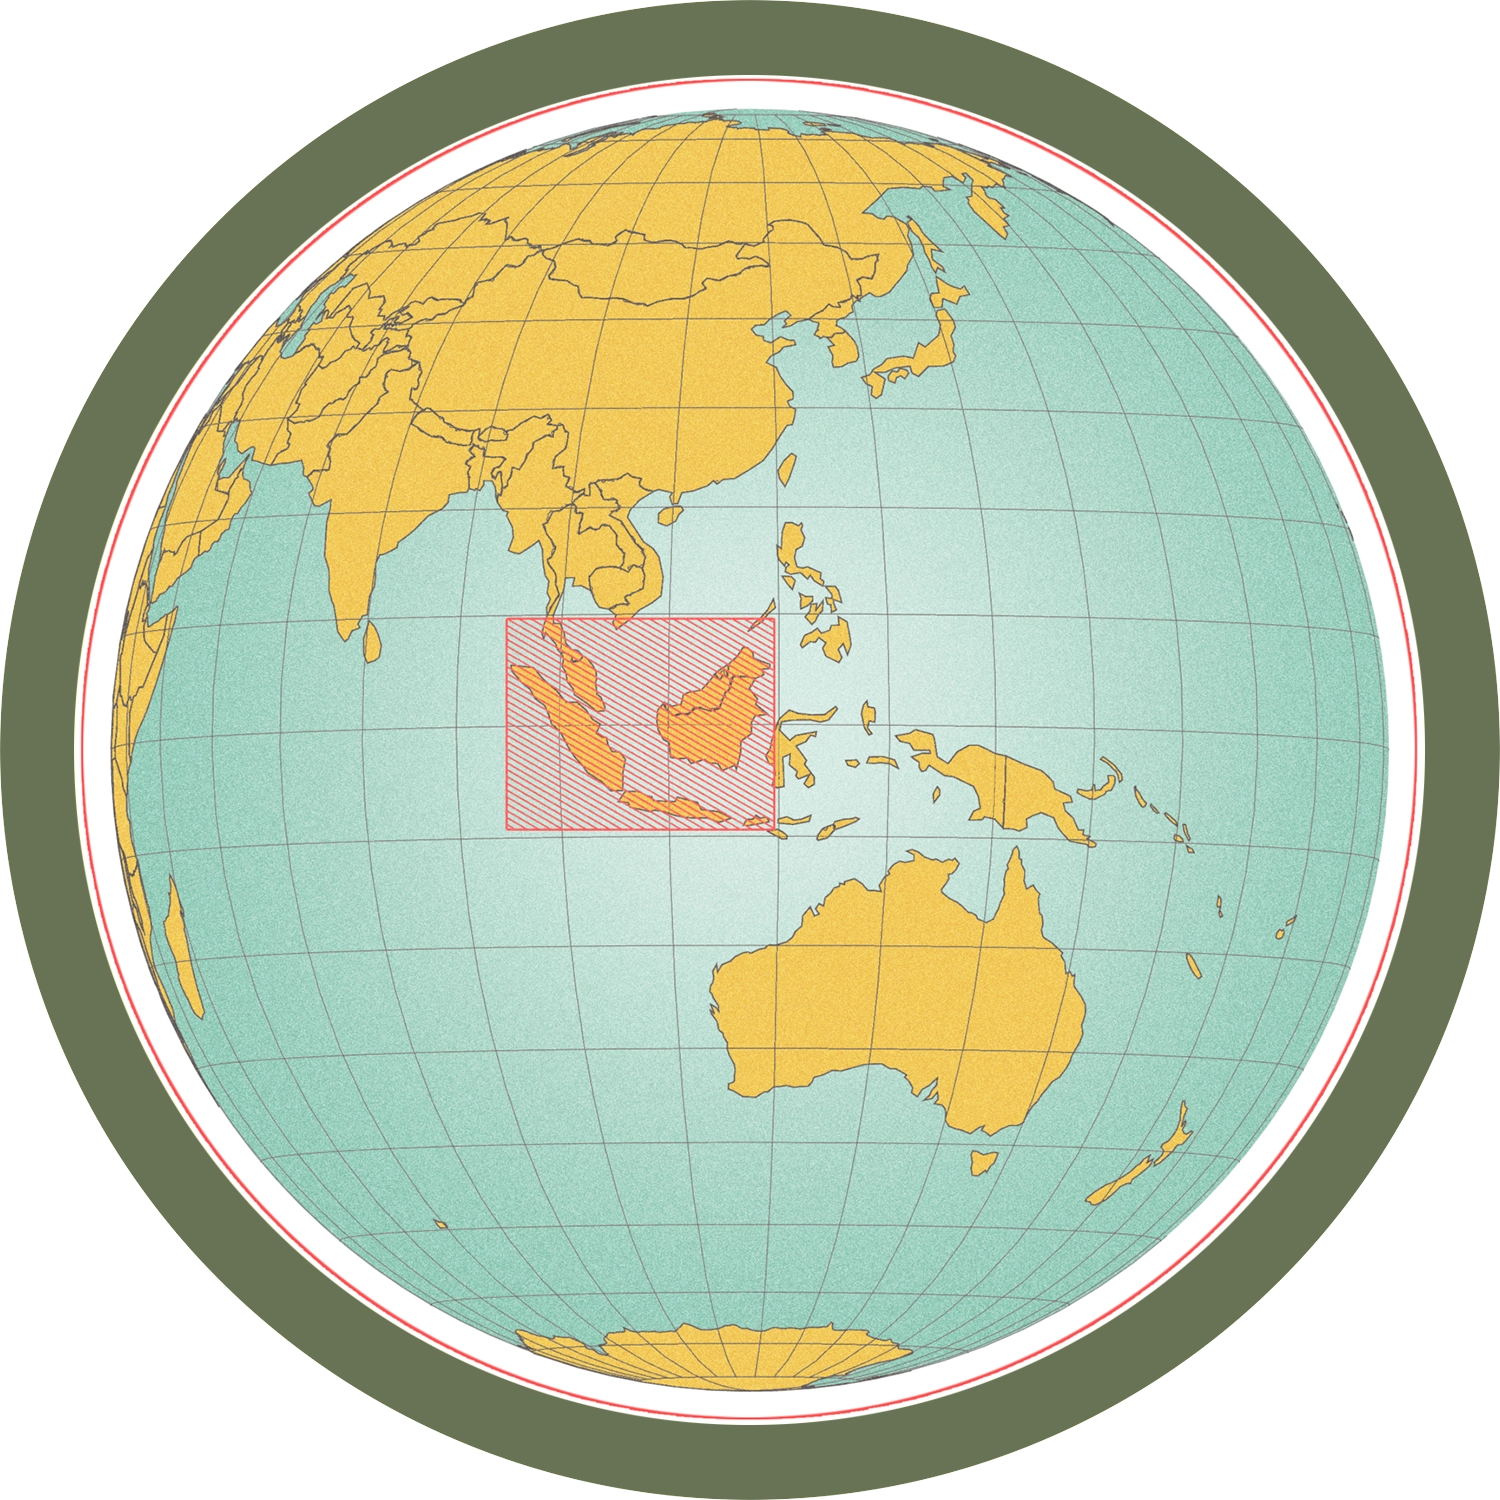
In Indonesia and Malaysia, palm oil and timber are the main drivers of forest loss. In particular, palm oil represents a significant global challenge. That's because while palm oil is responsible for huge levels of forest loss, it's also the most land-efficient option we have for cultivating oil crops.
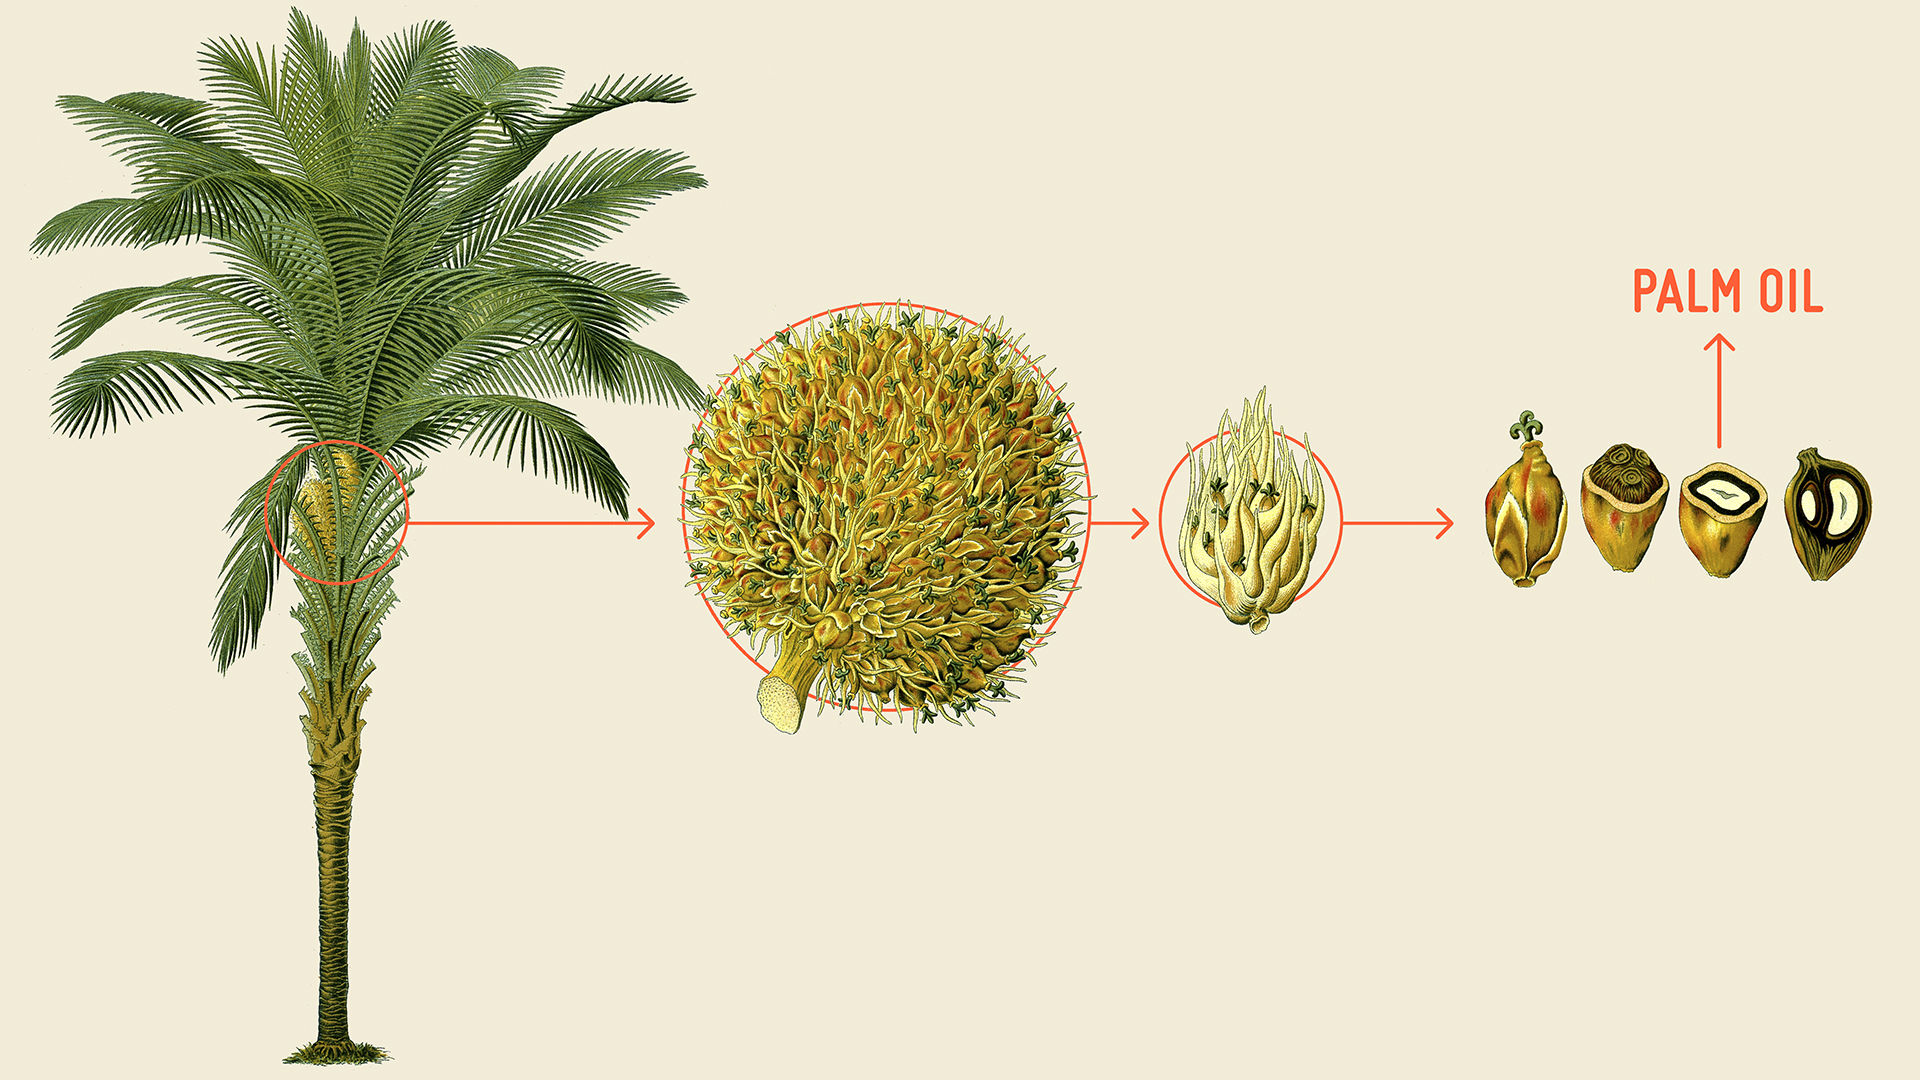
The dynamics of palm oil as it pertains to forest loss in the region are complex: spanning decades of changing policy, environmental, and economic conditions. The story is so fascinating and important, that it deserved its own report.
What can we do?
Remote sensing techniques like those shown here should be a cornerstone of data-driven approaches to wide-scale forest management. It's vital that these powerful tools are developed for all of the relevant stakeholders, integrated with local land stewardship expertize, and distributed openly to all.
From predicting and preventing illegal logging, to promoting sustainable agroforestry, our ongoing efforts to visualize forests in an intuitive, informative manner bring huge benefits for communications and strategy.
By building these processes procedurally, we make them even more powerful, because automated techniques developed for a site in one part of the world can be used to gain insights into a completely different area at any given time. This approach ties into wider themes at Crossground, outlined in Beyond Data Visualization and Unified Digital Twins.
Work with Crossground on Forest Loss
Crossground continues to engage in projects related to Forest Loss. Organizations interested in partnering, especially on earth observation and data-driven conservation, are encouraged to reach out at